Carbon Footprint of a POS Display: How to Measure It
If your brand reports sustainability, sooner or later you will be asked for the carbon footprint of your POS displays. And if you do not have it, you have a problem. More and more procurement teams are adding emissions data to supplier specifications, and physical POS material is a sensitive point: it has weight, it is transported, it is disposed of and, if poorly designed, it multiplies emissions campaign after campaign.
The good news: measuring a display’s footprint is not arcane science. There are standardised methodologies, public indicative values, and concrete levers that cut emissions by 30% to 70% depending on the design decision. In this article we walk you through it without jargon, with data and examples.
What exactly is measured when we talk about “carbon footprint”
The carbon footprint is expressed in kilograms of CO₂ equivalent (kg CO₂e) and groups all greenhouse gases (CO₂, methane, nitrous oxide, etc.) translated into a common unit.
For a POS display it is calculated by adding the emissions of four phases:
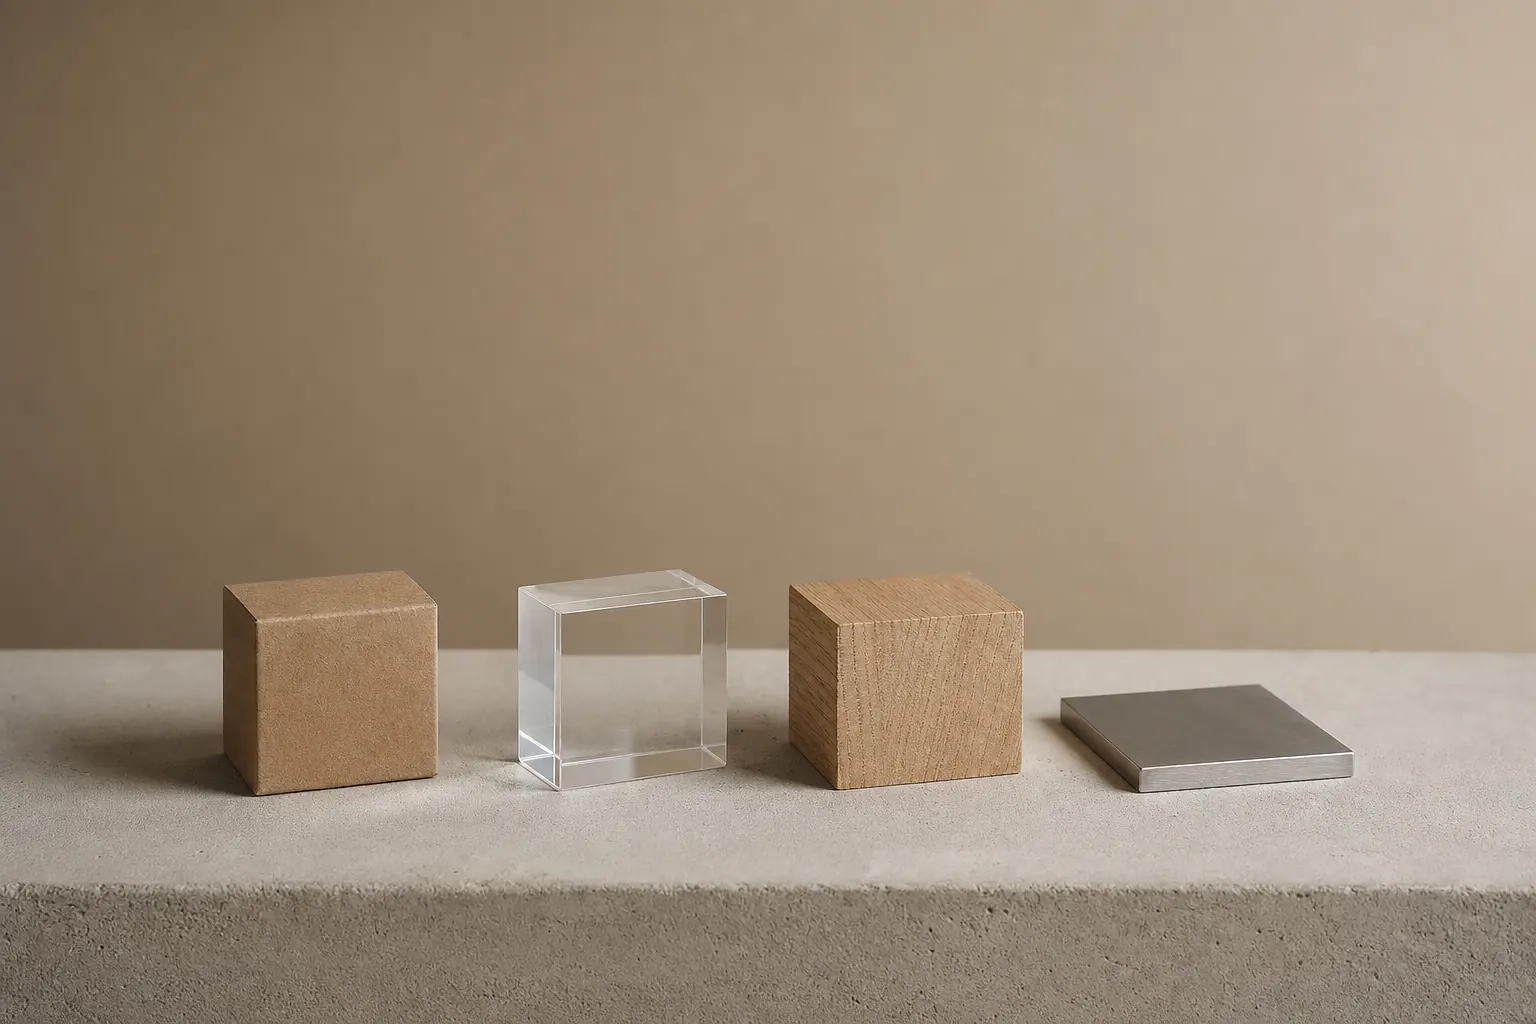
- Raw materials: extraction and production of cardboard, acrylic, wood, metal, inks, adhesives.
- Manufacturing: electrical and thermal energy used in the process (printing, die-cutting, assembly).
- Transport: from manufacturer to the client’s logistics hub and from the hub to the stores.
- End of life: recycling, landfill or incineration.
This is known as Life Cycle Assessment or LCA. The international standards that regulate it are ISO 14040 / ISO 14044, and for product-specific simplified versions, ISO 14067.
⚠️ What is usually not included (but the client sometimes asks for): emissions from the staff installing the display in-store, emissions from the consumer travelling to buy thanks to the POS display. In practice, those calculations broaden the scope and are rarely required for standard POS displays.
Indicative comparison by material
These are orders of magnitude for a standard countertop display (50 cm × 30 cm × 80 cm, 1-3 kg weight depending on material):
| Material | Estimated footprint (kg CO₂e) | Typical useful life | Footprint per year of use |
|---|---|---|---|
| Recycled FSC microflute cardboard | 2-4 | 1-3 months | 8-48 |
| FSC solid cardboard | 4-8 | 3-6 months | 8-32 |
| FSC wood (MDF/plywood) | 8-15 | 1-3 years | 3-15 |
| Acrylic (PMMA) | 25-40 | 3-5 years | 5-13 |
| Lacquered metal (steel) | 30-50 | 5-10 years | 3-10 |
| Glass | 15-25 | 10+ years | 1.5-2.5 |
Key reading: although cardboard looks like the “cleanest” option, its annual footprint can be higher than acrylic or metal if your campaign requires frequent replacement. Real sustainability depends on use, not just material.
Indicative sources: Ecoinvent and Plastics Europe databases. For a formal declaration to your client, a product-specific LCA signed off by an accredited consultant is required.
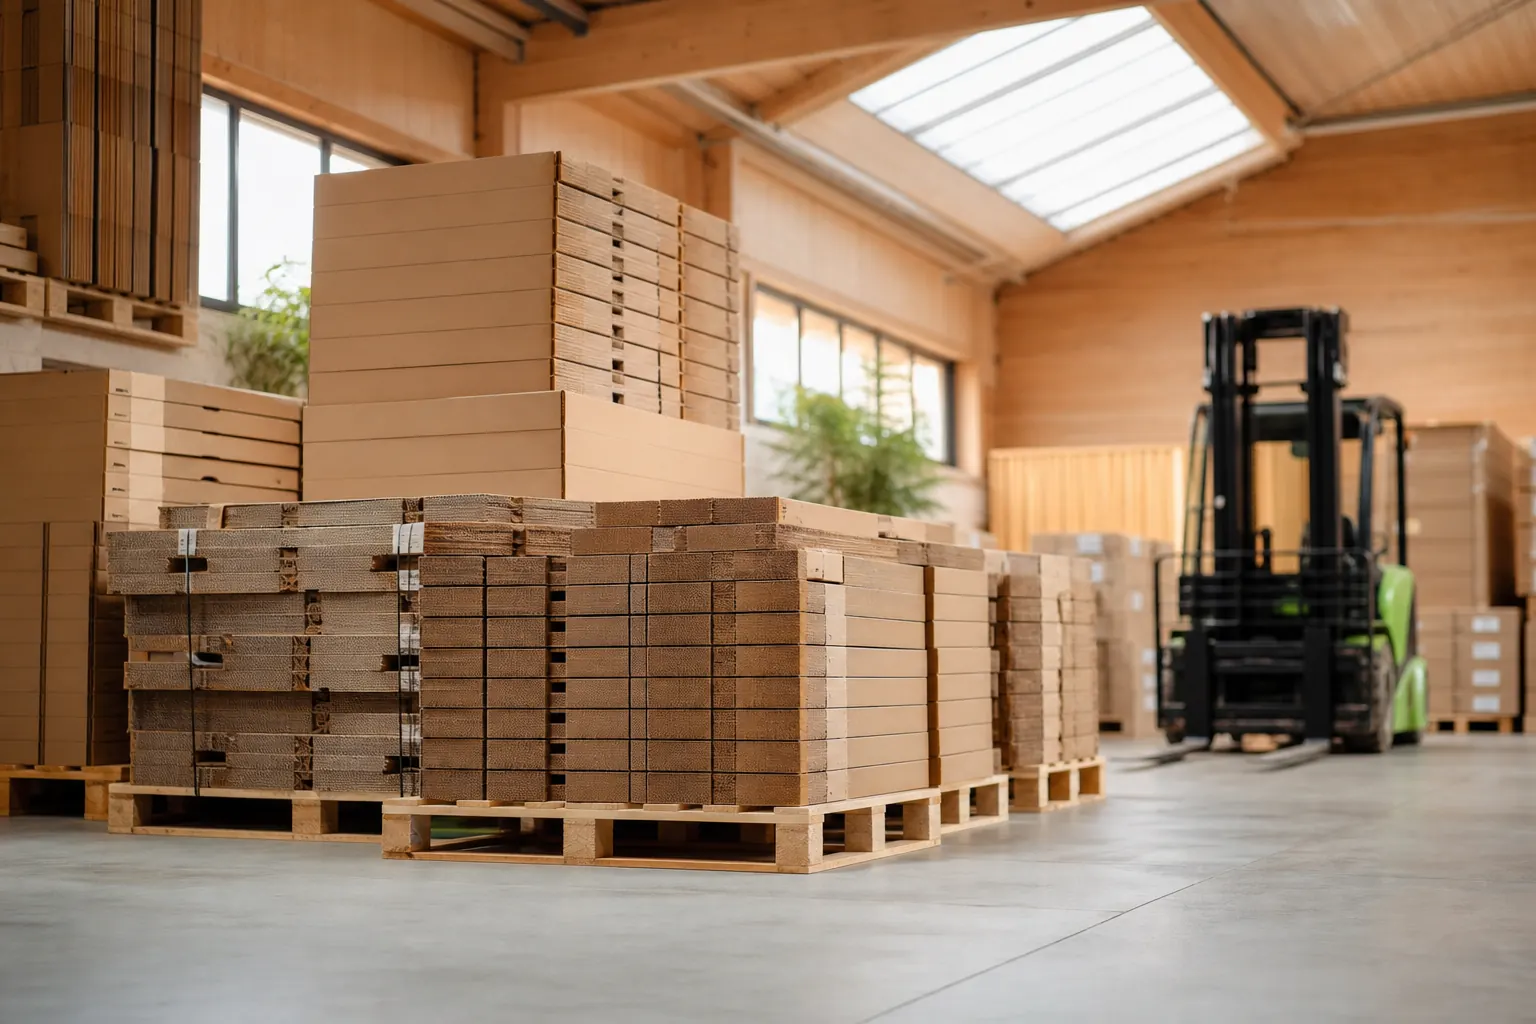
Packaging folded for transport can reduce logistics footprint by 60% to 80% per pallet.
The 5 phases where the footprint is decided
When designing a POS display, there are five moments where a decision is made that weighs in the final kg CO₂e:
1. Choice of paper/cardboard
- Post-consumer recycled: up to 40% lower emissions than virgin fibre.
- Geographic origin: European certified paper avoids the emissions of trans-oceanic shipping for Asian paper.
- Grammage: every additional gram is additional energy. A well-dimensioned design can save 10-15% without losing rigidity.
2. Ink type
- Water-based inks: low emissions, minimal VOCs, clean cardboard recycling.
- UV inks: better finish but moderate emissions.
- Solvent inks: the most polluting, increasingly phased out.
3. Finishes and laminates
- Without plastic lamination: cardboard is recycled cleanly.
- With matte/gloss plastic lamination: complicates recycling and adds emissions.
- Water-based varnishes: valid intermediate option for a matte finish.
4. Logistics
- Folding for transport: a display that travels folded occupies 4 to 8 times less of a truck. Each truck saved = 60-80 kg CO₂e saved per average journey.
- Order grouping: orders consolidated to the same destination reduce per-unit emissions.
- Manufacturer-to-client distance: 100 km saved ≈ 1-2 kg CO₂e per pallet.
5. Planned end of life
- Recycling (clean cardboard): near-zero net emissions, closes the loop.
- Landfill: worst case, especially with plastics.
- Reuse: if the client can reuse the structure for another campaign, the footprint is spread across several uses.
Modular design: the structure lasts years, the customisable pieces change campaign by campaign. Annual footprint falls by 60-75%.
Five concrete levers that actually reduce footprint
We are not talking about green slogans. These are concrete actions that, depending on the case, cut a POS display’s footprint by 20% to 60%:
- Demand paper with declared post-consumer recycled percentage. And require it to appear on the delivery note. “Recycled” without further detail is not acceptable.
- Design modular: permanent structure + interchangeable customisable pieces. The structure lasts years; the vinyl changes campaign by campaign.
- Optimise packaging by folding so the truck carries more units per journey.
- Close the loop with your client: an end-of-campaign return-and-recycle plan turns a waste stream into the raw material for the next campaign.
- Choose a local manufacturer when possible: 800 km is worse than 100 km, in both CO₂e and lead times.
📖 Go deeper into how to apply these levers in Reusable and modular POS displays: how to reduce waste in campaigns →
How to request a credible footprint figure from your manufacturer
If your client asks for the POS display’s footprint, these are the minimum data you must be able to deliver:
- Total estimated footprint of the display (kg CO₂e/unit).
- Breakdown by phase: raw materials, manufacturing, transport, end of life.
- Post-consumer recycled percentage of the paper/cardboard.
- Type of ink and varnish used.
- Geographic origin of the material and estimated transport kilometres.
- End-of-life scenario assumed (recycling, landfill, reuse).
If your manufacturer cannot provide this data, they are out of the running for a serious 2026 contract. If they give it to you but without methodology (no mention of ISO 14067, Ecoinvent or similar), request the calculation document.
At Atamark we work with simplified ISO 14067 methodology and deliver the full footprint breakdown in any quote where the client requests it. The question “how much CO₂e does this campaign represent?” has a signed answer.
Let’s talk about a POS display with measured and reduced footprint
If your next campaign has to contribute footprint data to your client’s ESG report — or if you simply want to make POS decisions with sustainable criteria — get in touch. We send you a quote with estimated footprint included and material options ranked by environmental impact, within 24 hours.
→ Request a quote with footprint included · Read the full POS display sustainability guide → · FSC vs PEFC for POS displays →
Frequently asked questions
How much CO₂e does a cardboard POS display have?
It depends on size and materials. A standard countertop display (50×30×80 cm) in recycled FSC microflute cardboard has an indicative footprint of 2-4 kg CO₂e. A larger floor-standing display can reach 10-15 kg CO₂e. The exact figure requires a product-specific Life Cycle Assessment.
Does the footprint include transport to the store?
Yes, it should. A serious POS display footprint calculation includes transport from the factory to the client’s logistics hub and from the hub to the stores. If the figure you are given does not include transport, it is incomplete.
What is the impact of choosing water-based inks over UV?
Water-based inks reduce the printing-phase footprint by 15-30% and, more importantly, allow much cleaner cardboard recycling (which improves the end-of-life balance). Their technical performance covers 90% of the finishes the POS sector requires.
Is a metal display with lower annual footprint worth more than a cardboard one with lower absolute footprint?
It depends on the campaign. If your POS display is going to be used in a single 6-week activation and then discarded, cardboard wins every time. If it is going to be reused campaign after campaign for 3-5 years with interchangeable pieces, modular metal or acrylic significantly lower the annual footprint.
Are POS display manufacturers ready to deliver footprint data in their quotes?
Few. It is one of the questions that best reveals a manufacturer’s maturity. The most professional ones already deliver a footprint breakdown with every quote on request. If your current manufacturer cannot or does not know how, that is a signal to evaluate or replace them.